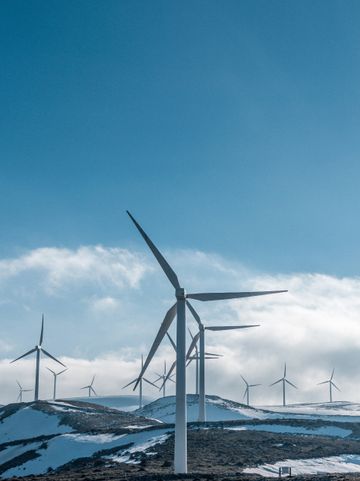
Photo © NASA Earth Observatory by Lauren Dauphin
10 years of Climatescope
Which market is the most attractive for energy transition investment?
2021 Ranking
Explore the latest ranking
2021 Key findings
Read about the key findings
2021 Full report
Download the full report
Explore 2021 results
Discover our 2021 ranking of 136 most attractive markets for 3 different sectors.
Explore the resultsSectors
All sectors163 indicators across 3 sectors
As of 2021, Climatescope analyses data from 136 markets across 3 sectors with a total of 163 indicators.
Explore sectors
Power
136 markets

TransportNew
136 markets

BuildingsNew
56 markets
Tools
All tools
Geography comparison
Select up to three markets to compare

Capacity & generation in emerging markets
Who has the most clean energy today?

Investment
Global energy transition investment jumped, despite the pandemic but investors’ attention shifted to developed markets
The energy transition investment gap is growing, despite COP26 pledges
Renewable energy investment jumped 24% in rich nations, but plummeted 9% in emerging markets
Policy
89% of emissions are covered by a net-zero target in force or under discussion
Renewable energy targets have been ineffective in influencing other policies
Clean buildings policies are highly concentrated in developed nations
Progress
Lockdowns impacted OECD and non-OECD countries differently
Wind and solar accounted for over two-thirds of net new capacity in 2020
Global passenger electric vehicle sales have tripled in four years
Emerging markets spotlight
All marketsAdditional insights
from BNEF
Explore more detailed information on global commodity markets and the disruptive technologies driving the transition to a low-carbon economy.

